
Economic Note
Economic Note prepared by Pierre Bentata, associate researcher at the Institut économique Molinari.
Read the Economic Note in PDF format
Read the Media release: Prices of innovative drugs: a debate that has been cut short
Drug prices in France are administered. This is due not to a battle between supply – from drug makers – and demand – from patients or their insurers, but rather to negotiations between public authorities, acting on behalf of patients whom they insure through social security, and pharmaceutical companies.
These negotiations are intended to establish objective prices without going through a competitive system in which day-to-day interactions between suppliers and consumers favour the emergence of a price reflecting the expectations and constraints they each face.
Drug costs and production processes also need to be addressed before knowing if it may be concluded – as the medical organization Médecins du Monde has done – that the public authorities can and must rectify “revolting” price escalations.
As we shall see, the high prices of certain drugs can be explained by a number of economic factors. Without a more competitive way of organising the health care system, the prices that are established are likely to diverge from those that would have been determined through a competitive process. Even so, it cannot be concluded that there will necessarily be significant room for manoeuvre in pushing down drug prices in the short term, except at the risk of hindering pharmaceutical innovation. Conversely, organising the system in a competitive way could provide opportunities for improvement.
INNOVATIVE DRUGS: REGULATED PRICES
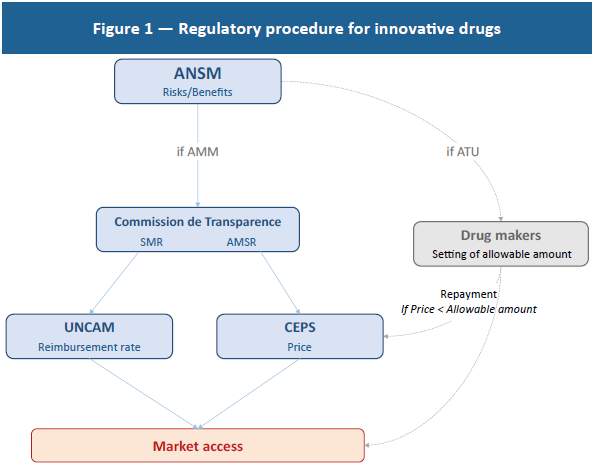 In France, bringing a drug to market involves a long regulatory process, marked out by the public authorities that administer drug prices (Figure 1). A drug maker must first file an application for an autorisation de mise sur le marché (AMM) (market access approval) with the Agence nationale de sécurité du médicament et des produits de santé (ANSM) (national drug and health product safety agency).(1) If the ANSM’s risk-benefit analysis leads to approval, the drug maker must decide if it wants its drug to be listed as a reimbursable drug.(2) If it does not want the drug to be listed, it is free to set the price. Otherwise, it must file an application with the Commission de transparence de la Haute autorité de la santé (transparency commission of the high authority for health) which will evaluate the service médical rendu (SMR) (therapeutic value) and then the drug’s amélioration du service médical rendu (ASMR) (improvement in therapeutic value).
The SMR provides an analysis of the therapeutic value of the drug compared to existing therapeutic strategies. This evaluation determines the reimbursement rate established by the Union nationale des caisses d’assurance maladie (UNCAM – national union of health insurance funds). The ASMR observes the improvement provided by the drug compared to drugs already in use. Based on this analysis, the Comité économique des produits de santé (CEPS) (economic committee on health products) determines the price of the drug: a drug rated ASMR 5 will cost less than existing treatments, while ASMR 4 – minor improvement – should not result in a higher cost than other treatments. ASMR 1 to 3, indicating major to moderate improvement, will lead to the price being set by negotiation(3) between the CEPS and the drug maker.(4)
The prices of reimbursable innovative drugs are thereby controlled by public authorities, whether the ANSM, the UNCAM or the CEPS.(5) Given the intent to control public spending, it is logical for the CEPS to determine drug prices in a way that limits abuses and is based on objective criteria.
A LONG TIME TO DEVELOP
Given that the prices of innovative drugs are regulated and established with a view to limiting public expenditure, how can they be explained? To answer this question, the process of developing an innovative molecule needs to be understood. Ten to 15 years elapse between the time a molecule is discovered and when it is brought to market. During this time, there elapse the molecule optimisation, pre-clinical trial and clinical trial phases,(6) involving tolerance analysis of the molecule and examination of the product’s effectiveness on small populations, followed by pivotal studies on test groups and, finally, regulatory scrutiny.(7)
The pharmaceutical industry operates over particularly long periods. By way of comparison, the development cycle is six to eight years in aeronautics,(8) two years in food(9) and only 15 to 22 months in electrical appliances.(10)
RISKY DEVELOPMENT
The longer it takes to develop a product, the greater the uncertainty of the results. This is an economic rule that is often ignored but that is nevertheless very real. For a company, as for those financing it, time is intrinsically risky. In the case of innovative drugs, this risk is made all the greater by the fact that failure can arise at any stage of development and even after market access is approved. In total, just one molecule out of 10,000 screened will be brought to market.(11) One out of 10 will be subject to clinical trial, with the others abandoned beforehand, while only one in 1,000 of those selected will finally come to market.(12) To these production risks are added the post-commercialisation risks related to drug safety monitoring. While it is legitimate to assess the effects of drugs after they are commercialised, it should be understood that the threat of market withdrawal by the public authorities represents an added risk that needs be covered.(13)
Failure is therefore an essential component of innovative drug development. In other words, drug R&D is intrinsically risky. While most sectors invest in R&D over the short term using technically controlled processes, drug firms are forced by their very nature to invest in basic research to find new processes, to develop new techniques and to supply genuinely innovative products.(14) The exploratory character of these industries is bound to make them riskier but also potentially more likely to produce disruptive innovations.
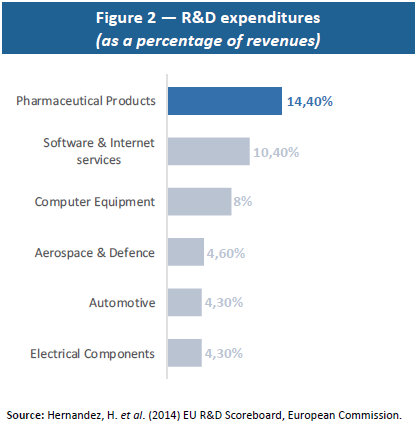 In concrete terms, the need to innovate results in a higher R&D weighting than in the other sectors as a whole (see Figure 2). From an economic standpoint, this spending represents sunk costs that need to be regarded as investments to be amortised rather than as current expenditures. In keeping with this definition, it appears that returns on investment in this sector are fairly low (8% in 2015) and comparable to those in other industries (7% in aeronautics, 10% in the automotive sector and 14% in the retail trade).(15)
The low profitability of innovative drugs is due to the fundamentally risky nature of this business.(16) As noted, basic research, which lies at the heart of the innovative drug development process, presents a substantial risk, with this research being multidisciplinary and experimental and requiring the aggregation of a large volume of technical and scientific knowledge.(17) As a percentage of their revenues, drug makers’ R&D expenditures are three times as great as the average among other industries and mostly involve basic research.(18)
Beyond the risk of failure pure and simple, an innovative drug may prove less effective than expected, with a direct impact on its SMR and ASMR and, ultimately, on the determination of its price by the CEPS. In this regard, only 14% to 20% of innovative drugs that are brought to market will be profitable, meaning that their prices and sales volumes will be sufficient to cover development costs.(19)
AN APPROACH WITH DIMINISHING RETURNS
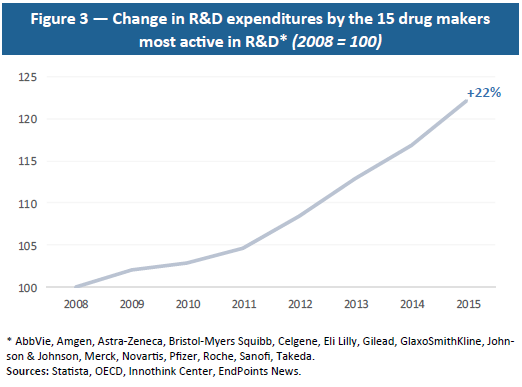 Moreover, drug R&D is a sector with diminishing returns: the greater the extent to which a disease is cured, the harder it becomes to cure remaining diseases, which tend to be more complex and to involve smaller numbers of people. This economic reality requires increasingly high R&D investment (see Figure 3) for a relatively stable number of drugs that are finally approved. As shown by Eroom’s Law (or reversed Moore’s Law), with a constant level of R&D investment, the number of drugs that are commercialised is divided by two every nine years, which means that ever-larger amounts have to be invested to produce new drugs.(20) The amounts invested and uncertainty as to their results also present a major financial risk.
The greater volatility in the financial returns of companies that invest heavily in R&D illustrates this reality.(21) Indeed, investors take account of R&D risk to the financial value of drug makers and pay heed to how many molecules are discovered and commercialised. In concrete terms, investors need to be reassured through guarantees of substantial funds to cover failures and higher compensation in case of success. Because R&D presents a risk for investors, it leads to volatility in returns that, in turn, requires greater compensation in case of success.(22) This explains why, despite the fact that no drug maker ranks among the world’s most profitable companies, two of them – Novartis and Johnson & Johnson – do rank among top market capitalisations, reflecting the scope of the funds needed for R&D and investors’ high expectations.(23)
Thus, for financial and technical reasons alike, the few successes in the innovative drugs sector need to finance the many failures. This “best-seller” logic is all the more significant in that drug makers are financed almost entirely – 99.7% – by private funds,(24) and 14% of their revenues are reinvested in R&D.(25)
For private investors, profitability is paramount and must offset the risks and the opportunity cost of the assets tied up in their investment. This remark, which may seem obvious, is a reminder that drug makers in search of funds to develop their products are in competition with all other companies and governments that issue stocks and bonds. An investor who put €100 on the S&P 500 from 2003 to 2015 would have enjoyed an average annual return of 9.03%, ending up with €282. To attract this investor, drug makers must be able to offer earnings that are at least equal to this if not higher since their business is riskier than average and developing a drug takes an average of 12.8 years.(26)
These economic constraints as a whole need to be taken into account by the public authorities since they define the price of an innovative drug, failing which they would imperil the sustainability of drug makers and future innovations. Therefore, in determining the price of an innovative drug, regulators must first assess its cost, including all development risks and failures.
The pharmaceutical and biotechnology sector is the biggest investor in R&D, at nearly €100 billion in 2013,(27) with 85% of this conducted by 15 drug makers. And they are forced to grow while focusing on less common pathologies with limited numbers of patients. In other words, as R&D investment rises, it covers a declining number of people, raising the per-patient cost. This explains the need to impose high prices on the small number of innovative drugs so as to produce margins great enough to cover all R&D expenditures.
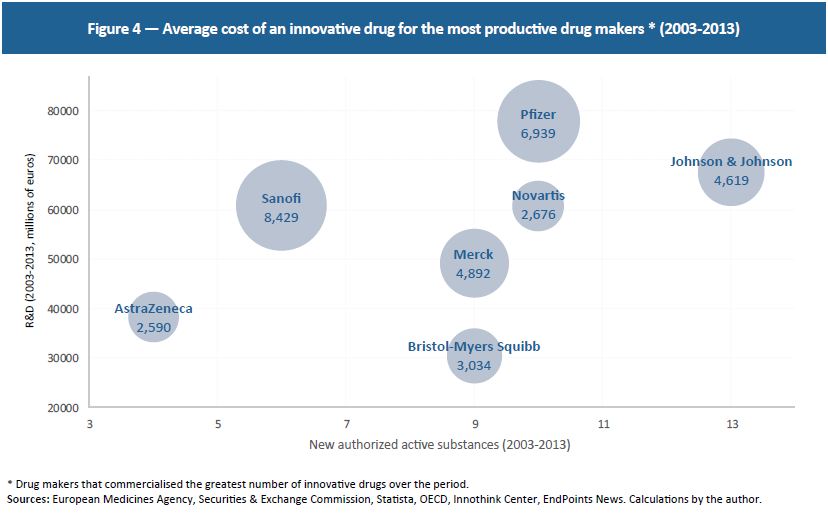 These 15 drug makers investing the most in R&D developed 28 innovative drugs in the last three years and 99 between 2003 and 2013. Meanwhile, they invest an average of €3.6 billion per year per firm. Although this is at the high end, since not all R&D goes toward innovative drugs, these figures point to an average cost of €4.3 billion per innovative drug over this period.(28) Since these are the firms that have commercialised the greatest number of innovative drugs over the last 10 years, R&D fluctuates between €2.5 billion and €8.4 billion per drug, showing that even highly productive drug firms face extremely high research costs (see Figure 4).
COSTLY REGULATION
To this must be added the cost of regulation. Since the time needed for approval and for setting the terms of reimbursement lengthens the process and raises uncertainty among investors, this may lead to higher prices. Indeed, for the reasons mentioned above, drug makers have an interest in bringing their products to market as soon as possible so as to maintain an edge over their competitors long enough to recoup their investments. The slower the regulatory process, the less incentive companies have to develop research, thereby reducing the number of drugs per company and raising the selling prices of drugs that make it to the market. In other words, approval time and control hold back the number of projects, forcing companies to make up their margins on a limited number of drugs.(29) The innovative drug sector is among the most heavily regulated, with nearly one-third of drugs that have gone through all the testing phases failing to reach the market.(30) While regulation is vital in protecting future patients and society as a whole, it should be understood that it presents a cost when it is delayed or prevents a drug from coming to market.
AN INCENTIVE TO RELY ON VOLUME
In addition, price regulation gives drug makers an incentive to increase volumes, producing a negative effect on public spending.(31) This price control also heavily reduces R&D incentives by limiting the profitability of investments.(32) However, R&D determines the quantity of products developed and brought to market, with this quantity in turn influencing long-term price levels by affecting drugs’ probability of success. It therefore needs to be understood that high prices in the short term guarantee future discoveries and a decline in long-term prices. In other words, “the cost of innovation is the price of progress.”(33) The case of Sovaldi® sums up this state of affairs perfectly. Although a three-month treatment costs €41,000, it helps cure 90% of patients who would otherwise have cost an average of €100,000 for a longer and less effective treatment.(34)
CONCLUSION
Far from being freely set by drug makers, the price of reimbursable innovative drugs is determined by the public authorities. Under these conditions, it is difficult to regard the prices of certain drugs as being too high due to an absence or inadequacy of regulation, contrary to what is suggested by a recent Médecins du Monde campaign.
If it turned out that the prices of certain innovative drugs were economically too high, which in any case is far from certain given that there scarcely exists a free market in this area, this would reveal instead a failure by regulators, who base their approach on their perception of how much new molecules contribute and of development and production costs. Both these aspects can be hard to size up in a highly regulated environment, and this is likely to hinder the emergence of relevant signals. Also, rather than condemn drug prices as such, it would make more sense to question the ability of a monopolistic system to generate reliable information on benefits and costs while ensuring an optimal quality-price ratio.
From an economic standpoint, it is not clear that a system built to orchestrate accounting control of costs is most appropriate for maintaining the effectiveness of health care spending. In terms of prices, there are probably two approaches that can be followed: the one taken by the public authorities aimed at continuously regulating imperfect price-setting procedures, and the other turning to true competition in setting prices, relying on decentralised players. The latter approach is clearly the more promising, though it would mark a break with current practice. Rather than let monopolistic entities negotiate prices with manufacturers, it would involve turning to multiple negotiations between insurers or mutual benefit societies – guarantors of the search for better quality-price ratios – and drug manufacturers.
REFERENCES
1. With certain innovative drugs that are to be commercialised simultaneously in several European countries, the AMM may be evaluated by the European Medicines Agency rather than by the ANSM.
2. Outside this procedure, the ANSM may issue an autorisation temporaire d’utilisation (ATU) (temporary approval for use) authorising the pharmaceutical company to supply its drug before its price is established, directly setting an allowable amount. In this case, if the price set later by the Comité économique des produits de santé (CEPS) (economic committee on health products) is lower than this amount, the drug maker must repay the difference.
3. Section 162-16-4 of the Code de la Sécurité Sociale.
4. The drug maker is entitled use a “price filing” procedure through which it suggests a price, but in case negotiations fail, the CEPS may set a price unilaterally.
5. It should also be noted that drug makers play a role in controlling social security expenditures through conventional rebates or the safeguard clause. Both are based on the “k” rate, which is the rate of increase in drug makers’ revenues set in the Social Security Financing Act. Whichever mechanism they select, drug makers must pay a contribution once the growth in their revenues exceeds the “k” rate. Drugs recognised as providing an ASMR are nevertheless exempted for a period of 24 to 26 months under Section L138-10 of the Code de la Sécurité Sociale.
6. For a detailed description see Lemoine B (2004) “La genèse d’un médicament : complexité et coûts croissants pour une innovation sans prix”, Presses de Sciences Po: Les Tribunes de la santé, 1(2): 47-57.
7. Winegarden W (2014) The Economics of Pharmaceutical Pricing, Pacific Research Institute.
8. CESAR Project, EU Cost Effective Small Aircraft Project, www.cesar-project.eu.
9. Aramouni F & Deschenes K (2014) Methods for Developing New Food Products: An Instructional Guide, DEStech Publications.
10. Bascle I et al. (2012) Speed to Win: How Fast-Moving Consumer-Goods Companies Use Speed as a Competitive Weapon, BCG Group.
11. Degrassat-Théas A (2013) Prix, concurrence et régulation: soutien à l’innovation et prix des médicaments à l’hôpital, Economies et Finances, Thèse de l’Université Paris Dauphine — Paris I.
12. California Biomedical Association, Fact Sheet: New Drug Development Process, https://www.ca-biomed.org/pdf/media-kit/fact-sheets/CBRADrugDevelop.pdf
13. The discovery of side effects can lead to a product being withdrawn several years after it comes to market, which can lead to popular panic and to a risk of bankruptcy for drug makers. Although perfectly understandable, high sensitivity among the population to the least danger from drugs presents a risk that is specific to drug makers. See Fleming M & Lardner R (1999) “When is a risk not a risk?”, The Chemical Engineer, July, 14-16.
14. Mansfield E (1984) “R&D and Innovation: Some Empirical Findings”, in Zvi Griliches (ed.), R&D, Patents and Productivity, Chicago Univ. Press.
15. See CSI Market (csimarket.com) and Baber W & Kang S (1991) “Accounting-based measures as estimates of economics rates of return in the U.S. pharmaceutical industry”, U.S. Office of Technology Assessment. Scherer and Ramsey observe that returns of investment may be 2% to 6% higher than in the other sectors over all. Ramsey SD (2007) “How should we pay the piper when he’s calling the tune? On the long-term affordability of cancer care in the United States”, Journal of Clinical Oncology, 25(2): 175-79. See also Scherer FM (2000) “The pharmaceutical industry”, Handbook of Health Economics, vol. 1.B: 1298-1336.
16. It should be noted that the high profits recorded when an innovative drug is commercialised must be appraised in light of past R&D investments that need to be amortised. Based on this definition, returns are low.
17. Kenney M (1986) Biotechnology: the university-industrial complex, London: Yale University Press. See also Henderson R & Cockburn J (1994) “Measuring Competence? Explanatory firms effects in pharmaceutical research”, Strategic Management Journal, 15:63-84.
18. Cohen F (2005) “Macrotrends in Pharmaceutical Innovation”, Nature Reviews Drug Discovery, 4: 78-84.
19. Lemoine B (2004) op. cit. See also Vernon JA, Golec JH, DiMasi JA (2010) “Drug Development costs when financial risk is measured using the Farma-French Three Factor Model”, Health Economics, 19(8): 1002-1005.
20. Scannel JW, Blanckley A, Boldon H & Warrington B (2012) “Diagnosing the decline in pharmaceutical R&D efficiency”, Nature Reviews Drug Discovery, 11: 191-200.
21. Mazzucato M & Tancioni M (2008) “Innovation and idiosyncratic risk: an industry and firm-level analysis”, Industrial and Corporate Change, 17(4): 779-811.
22. Chan L, Lakonishok J & Sougiannis T (2001) “The Stock Market Valuation of R&D Expenditures”, Journal of Finance, 56(6): 2431-56.
23. These two companies have been among the most productive over the last decade, which explains why they have attracted more capital, with their R&D strategy being more effective. They are nevertheless subject to greater risk since, the higher the investments in R&D, the greater the volatility in stock prices. See Mazzucato M & Tancioni M (2012) “R&D, Patents and Stock Return Volatility”, Journal of Evolutionary Economics, 22(4): 811-832.
24. Lemoine B (2004) op. cit. It should be noted that public R&D, while substantial, cannot be a substitute for private R&D, because it covers research upstream from the development of innovative molecules. In other words, drug discovery cannot be attributed to public research. See the King’s College London reports (2016) Public medical research drives R&D investment, The Policy Institute of King’s, and CBO (2006) Research and Development in the Pharmaceutical Industry, United States Congress.
25. Masson A (2004) PharmaFrance 2004, French Ministry of the Economy, Finance and Industry.
26. Dickson M & Gagnon J-P (2009) “The Cost of New Drug Discovery and Development”, Discovery Medicine, 4(22): 172-79.
27. Hernandez H et al. (2014) op. cit. http://iri.jrc.ec.europa.eu/documents/10180/354280/EU%20R%26D%20Scoreboard%202014
28. Based on the R&D expenditures of the 15 drug makers, we estimate annual R&D spending for each of them that we compare to the average number of innovative molecules commercialised annually. The result obtained is close to Winegarden’s conclusion. Observing a random sample of drug makers rather than the key investors, DiMasi et al. estimate an average cost of $2.9 billion before regulatory costs. Winegarden W (2014) op. cit.; DiMasi JA, Grabowski H & Hansen R (2016) “Innovation in the pharmaceutical industry: New estimates of R&D costs”, Journal of Health Economics, 47:20-33.
29. Danzon P, Wang R & Wang L (2005) “The impact of price regulation on the launch delay of drugs — evidence from twenty-five major markets in the 1990s”, Health Economics, 14: 269-92.
30. Deloitte (2014) High value, high uncertainty: Measuring risk in biopharmaceutical research and other industries, Belgium: Deloitte ed.
31. Martin E. (1996) “Recherche pharmaceutique, prix du médicament et assurance maladie”, Revue française d’économie, 11(1): 49-86.
32. Vernon notes that price controls in the United States would cause a decline of 23% to 32% in R&D in the country. Vernon JA (2005) “Examining the link between price regulation and pharmaceutical R&D investment”, Health Economics, 14:1-16.
33. Kleinke JD (2001) “The price of progress: prescription drugs in the health care market”, Health Affairs, 20(5): 48-60.
34. HAS (May 14, 2014) Avis Sovaldi, http://www.has-sante.fr/portail/upload/docs/evamed/CT-13392_SOVALDI_Insc_PIC_Avis%201_CT13392.pdf.